A driver fatigue monitoring system is any technology that detects drowsiness or physiological impairment in a driver and raises an alert before it causes an accident. The right system for your fleet depends on four variables:
This guide isn’t about whether fatigue monitoring matters: fatigue contributes to around 20% of fatal road accidents according to the European Road Safety Observatory, and fleets relying on schedules and self-reporting are managing risk they can’t see. It’s about which system, deployed how, and against what criteria. Whether you’re making your first investment, upgrading from cameras or building a multi-layered setup, it gives you the framework to decide with confidence.
Key takeaways
- There are four types of fatigue monitoring system: EEG, camera, telematics and attention monitoring.
- Detection timing defines value: EEG alerts at stage 1 of 5, cameras at stage 3, telematics at stage 4.
- The strongest setup is layered: EEG as the primary layer, cameras second, telematics third.
- Prove it with a structured 8–12 week pilot before rolling out fleet-wide.
The four types of driver fatigue monitoring systems
Every system on the market falls into one of four categories, each detecting something different and offering a different level of protection:
- Best for
- Long-haul, overnight, remote and high-risk corridors
- Watch out for
- Drivers must wear the headband; clear communication about its protective purpose is essential.
- Best for
- Passive monitoring, video evidence, fleets wary of wearables
- Watch out for
- Reactive: fires only once symptoms are visible. Sunglasses, lighting and dirty lenses can affect it.
- Best for
- Fleets already on telematics; a confirmation layer
- Watch out for
- Reactive: on good motorways, fatigued drivers can hold their lane long after impairment begins.
- Best for
- Urban and regional delivery; pairing with fatigue monitoring
- Watch out for
- Doesn’t detect physiological fatigue. A complement, not a fatigue system.
System comparison matrix
Here’s how the four types compare across the criteria that matter most in procurement:
| EEG | Camera | Telematics | Attention | |
|---|---|---|---|---|
| Detection timing | Earliest Neurological onset, before physical signs | Mid Once physical signs are visible | Late Once driving performance degrades | Real time, but distraction only |
| What it measures | Brainwave activity, directly | Face and movement, via AI | Vehicle dynamics and driving behaviour | Gaze, head position, device use |
| Driver action needed | Yes: wear the device correctly | No: passive | No: built into the vehicle | No: passive |
| Environmental limits | Minimal: unaffected by light or appearance | Sunglasses, lighting, dirty lens | Good road surfaces can mask impairment | Lighting, camera position |
| Fleet analytics | High Continuous data for deep pattern analysis | Moderate Event records for review and coaching | Moderate Fits existing fleet reporting | Moderate Complements fatigue analytics |
| Regulatory value | Goes beyond current mandates | Helps meet EU GSR requirements | Supports tachograph and hours compliance | Supports distraction duty of care |
| Privacy | No video; anonymisable, GDPR-ready architecture | Continuous face video; GDPR and works council issues | Vehicle and route data; lower sensitivity | Gaze and face data, similar to cameras |
| Role in your setup | Primary Prevention | Secondary Detection | Tertiary Confirmation & compliance | Complementary Distraction coverage |
The detection timeline: why it defines system value
The most important concept in evaluating these systems is the detection timeline: the stages fatigue moves through, and the point at which each system steps in.
A system that detects at stage 1 gives four stages of warning before critical impairment; one that detects at stage 4 gives one. At motorway speeds, that’s the difference between a near miss and a fatal crash.
8 questions to ask before choosing a system
Use these to evaluate each option against your fleet’s own requirements:
The multi-modal architecture
The most effective setups aren’t a single technology but layers that work together, each compensating for the limits of the others and reducing both false alarms and missed fatigue:
For lower-risk operations or tighter budgets, cameras plus telematics are a meaningful step up from no monitoring, with EEG added as your safety investment and evidence grow.
📘 Read more: a side-by-side look at lead time, privacy and driver acceptance in Driver Drowsiness Detection: How EEG and Cameras Compare.
Pilot framework: from evaluation to deployment
A structured pilot gives you real-world performance data, driver feedback and ROI evidence for your own operation:
💡 Key insight: Shorter pilots don’t generate enough data for a confident decision. Include your highest-risk routes, and treat driver engagement as part of the pilot, not an afterthought.
Which system is right for your fleet?
Go deeper on every topic
This guide is the hub of our fatigue monitoring content. Explore each topic in detail:
Next step
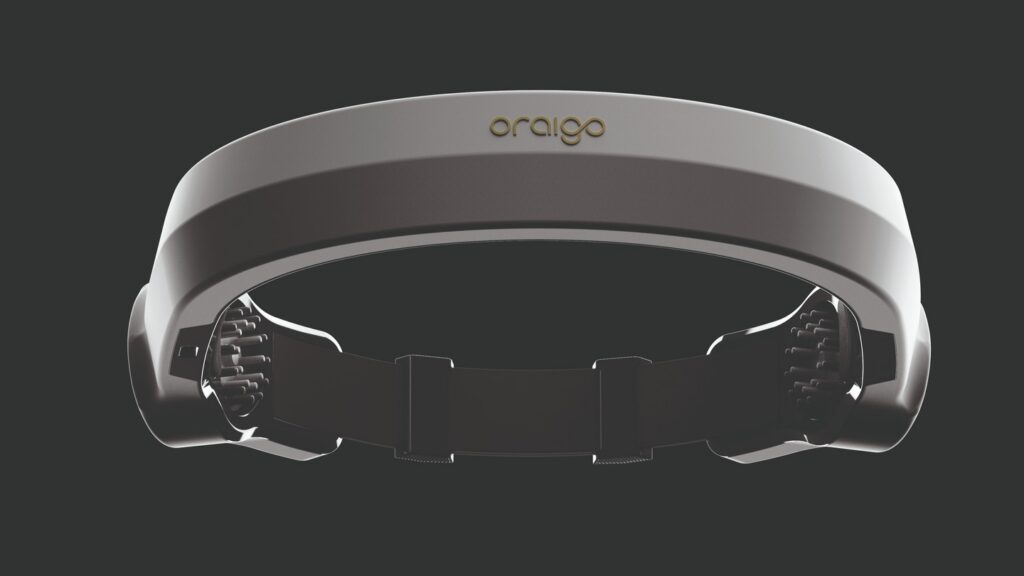
Oraigo’s EEG-based Aigo system and fleet platform support every stage, from first pilot to fleet-wide rollout. Start a free pilot or talk to one of our specialists to find the right monitoring setup for your fleet.