Most fleets already run fleet safety telematics: GPS tracking, driving behaviour scores, tachograph data. It tells you a lot about the vehicle. What it can’t tell you is whether the driver was alert. This guide explains how to add fatigue alerts to an existing telematics setup, from data flow and alert routing to dashboards and privacy.
Key takeaways
- Fleet safety telematics shows what the vehicle did. It can’t show whether the driver was alert when it happened.
- A physiological fatigue layer adds the missing driver-state signal, matched to your telematics data by time, vehicle and shift.
- Integration ranges from side-by-side dashboards to exports and API feeds. Start simple and add depth once the data proves useful.
- Route alerts by severity, and keep individual data with the driver while managers see anonymised, fleet-level patterns.
What telematics captures, and what it misses
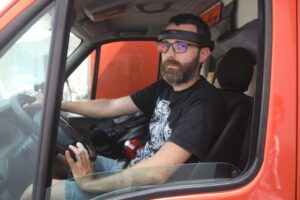
Telematics records what the vehicle does. Fatigue shows up there only indirectly, as a harsh brake or a lane drift, after alertness has already dropped. A physiological layer fills that gap:
| Signal | Telematics | + EEG fatigue layer |
|---|---|---|
| Location, speed, route | ✓ Core data | Not needed |
| Harsh braking, cornering, lane drift | ✓ After the event | Context: was the driver fatigued at the time? |
| Driving and rest hours | ✓ From tachograph or ELD | How alert the driver actually is within those hours |
| Driver alertness | ✕ Not measured | ✓ Read directly from brain activity |
| Early fatigue warning | ✕ Only once driving changes | ✓ Before visible signs appear |
| Driver video | Optional, with dashcams | ✓ None: camera-free |
💡 Key insight: Telematics tells you what happened. A fatigue layer tells you why, and can warn the driver before it happens.
How the data flows
The fatigue layer runs as a second stream next to your telematics. The in-cab alert reaches the driver directly, without waiting for any integration:
Because the two streams share the same vehicles, shifts and timestamps, you can line them up: fatigue events next to harsh-driving events, or alertness trends across a route.
📘 Read more: how EEG detection compares with camera-based driver monitoring in Driver Monitoring Systems: Camera-Based vs Camera-Free.
Three ways to integrate
You don’t need a full API project on day one. Choose the depth that fits your IT capacity:
- Live in days
- No integration work
- Manual comparison
- Weekly or monthly trends
- Joins on vehicle, shift, time
- Good for safety reviews
- One screen for dispatch
- Automated workflows
- Depends on both vendors’ APIs
Routing alerts to the right person
Not every fatigue signal needs a phone call. Route alerts by severity so drivers get support and dispatchers aren’t flooded:
| Alert level | Driver | Dispatcher | Safety manager |
|---|---|---|---|
| Early sign | In-cab alert: plan a break | No notification | Included in trend reports |
| Repeated | Stronger alert: stop at the next safe place | Notified: adjust the route or delivery window | Weekly review |
| Critical | Urgent alert: stop now | Immediate call to the driver | Notified, follow-up after the shift |
What the dashboard should show
Fleet-level views turn individual alerts into decisions about routes and rosters:
💡 Key insight: The most useful combined view is often the simplest: fatigue events by hour of day and route, next to your existing telematics events.
Keeping it anonymous at fleet level
Driver-state data is more sensitive than vehicle data. Design access by role from the start:
- Real-time alerts in the cab
- Own history, if enabled
- Repeated and critical alerts
- Vehicle and route context
- No raw brain data
- Trends by route, shift, depot
- Anonymised and aggregated
- No individual ranking
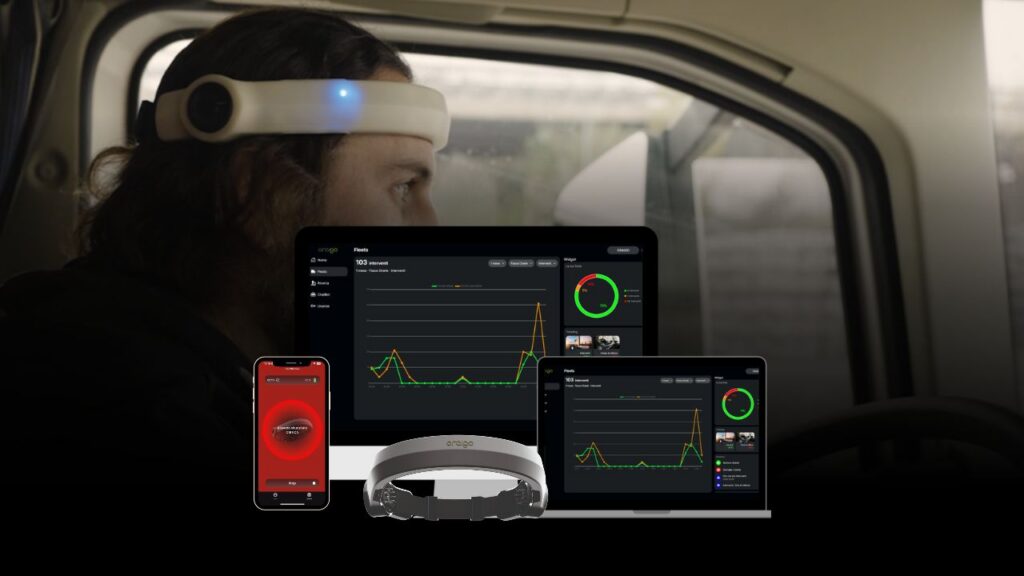
Oraigo’s platform shares fleet data in anonymised, aggregated form, with no camera and no video of drivers. That makes it easier to agree with drivers and works councils.
Implementation checklist for ops and IT
📘 Read more: the technologies, benefits and procurement checklist in our guide to driver fatigue monitoring systems.
Add the missing signal to your telematics
Oraigo’s Aigo headband, Go app and Fleets dashboard add driver alertness to the vehicle data you already have. Start a free pilot alongside your telematics or talk to one of our specialists about integration.