
Fleet insurance cost isn’t a fixed price you have to accept. It’s an underwriter’s estimate of what your fleet is likely to cost them, plus their expenses and margin. Safety measures lower premiums when they change the inputs that estimate is built on, and when you can show the evidence.
This guide is for the finance and operations teams who sign off on safety spend. It breaks down how fleet premiums are priced, which cost drivers you can actually influence, which safety measures insurers recognise, and how to present the evidence to your broker.
Key takeaways
- Your premium is mostly expected losses: how often you claim and how much each claim costs.
- Safety measures lower fleet insurance cost only when they change what insurers price, and when you can prove it.
- The levers you control most: claims history, claim frequency, driver profiles and documented risk control.
- Bring evidence, not promises: a structured broker pack 90–120 days before renewal.
How fleet insurance premiums are priced
Every fleet premium comes down to the same building blocks. The largest is expected losses: the insurer’s forecast of how often you’ll claim and what those claims will cost.
You influence this
You influence this
Outside your control
Underwriters forecast expected losses from your track record, usually through your loss ratio: claims paid divided by premium earned over several years. A consistently low loss ratio is the strongest argument you can bring to a renewal. A high one makes every other conversation harder.
The cost drivers behind your premium
Here’s what underwriters weigh, how much of each you control, and what moves it:
| Cost driver | What the underwriter looks at | Your control | What moves it |
|---|---|---|---|
| Claims history & loss ratio | Several years of loss runs: claims paid against premium earned | High | Every measure that cuts claims; clean incident records |
| Claim frequency | How often incidents happen per vehicle or per km | High | Telematics coaching, fatigue monitoring, training |
| Claim severity | Average cost per claim, driven by injuries, liability and repairs | Medium | Fatigue monitoring, speed management, fast incident response, dashcam evidence |
| Driver profiles | Licence records, experience, turnover, training history | High | Hiring checks, recurring training, driver retention |
| Vehicles | Type, age, value, safety features and maintenance records | Medium | Preventive maintenance, fleet renewal with active safety tech |
| Operations | Radius, hours, night driving, cargo and routes | Low–Medium | Route risk assessment, scheduling, fatigue controls on risky routes |
| Risk control evidence | Documented safety policy, monitoring data and governance | High | Written programmes backed by data you can share |
| Market conditions | Repair costs, legal awards, reinsurance prices, insurer appetite | None | Nothing directly, but a strong risk profile limits the impact |
💡 Key insight: Market conditions are the one driver you can’t touch, and they’ve pushed commercial auto premiums up for years. That makes the controllable drivers more valuable: a strong risk profile is what separates a fleet that absorbs market increases from one that limits them.
Which safety measures insurers recognise
Insurers don’t reward spending; they reward measures that cut claim frequency or severity, and the data that proves it. Here’s how common measures map to what insurers price:
| Safety measure | Fewer claims | Cheaper claims | Evidence for insurers |
|---|---|---|---|
| Telematics & driver scoring | |||
| Dashcams & event recorders | |||
| Fatigue monitoring (EEG) | |||
| Distraction monitoring | |||
| Recurring driver training | |||
| Preventive maintenance | |||
| Incident reporting & claims protocol |
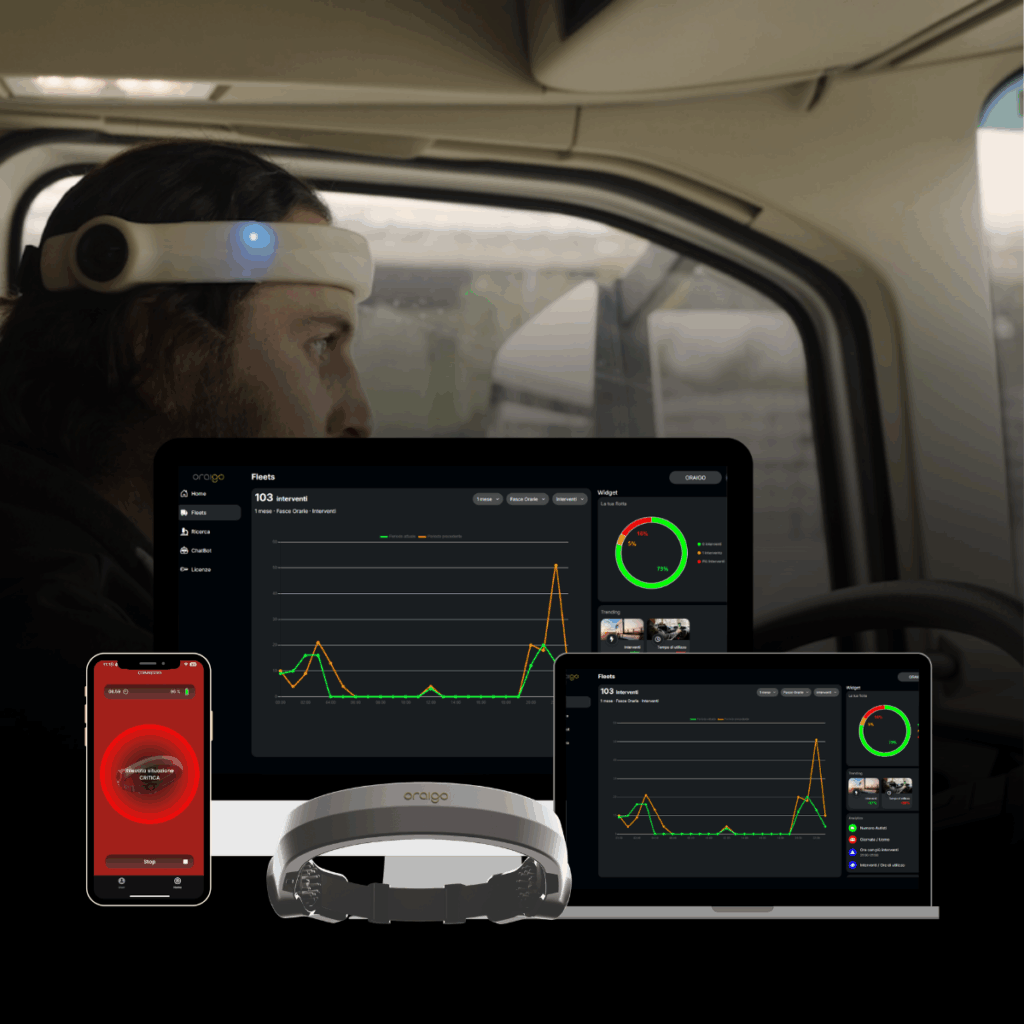
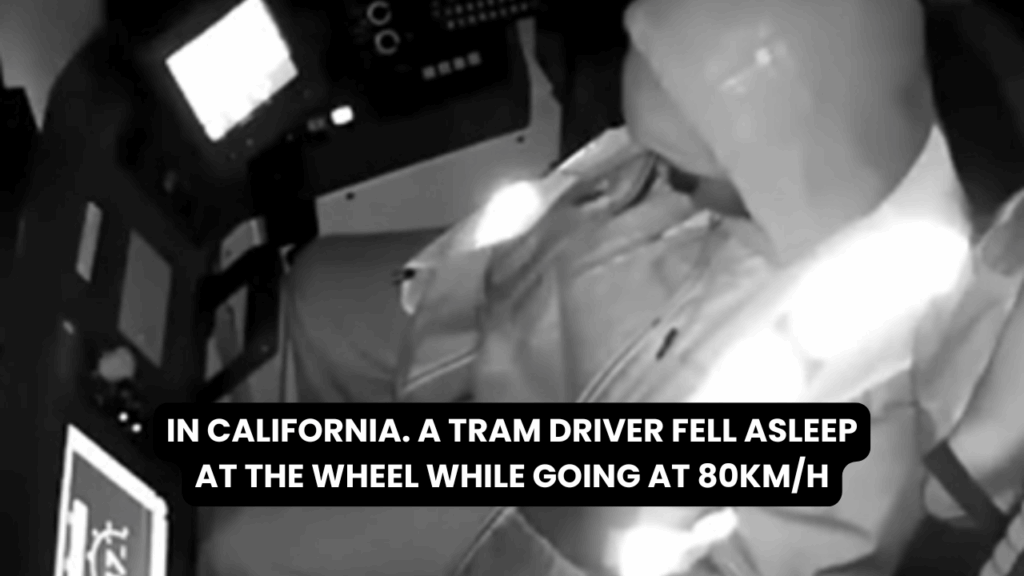
Fatigue monitoring stands out because fatigue drives both frequency and severity: it contributes to around 20% of fatal road accidents, according to the European Road Safety Observatory. EEG-based systems such as Oraigo’s Aigo also produce objective data on how risk is being controlled, which is exactly what an underwriter wants to see.
📘 Read more: how EEG compares with camera and telematics systems in Driver Fatigue Monitoring Systems: A Guide for Fleets.
Why safety savings compound
Premium benefits don’t arrive in one renewal. Because underwriters look back over several years, each year of lower claims improves the next renewal. The gap between two fleets widens over time:
How to present evidence to your broker
Your broker can only argue for better terms with the evidence you give them. Build a renewal pack that turns your safety programme into numbers an underwriter can price:
Timing matters as much as content. Start well before renewal so your broker has time to take a strong story to market:
Building the internal business case
For finance, the question is net return, not premium savings alone. Insured claims are only part of what an incident costs: deductibles, vehicle downtime, management time and lost contracts sit on your own books.
Set a baseline before you invest, track claims and incidents monthly, and report the savings alongside safety results. A pilot on your highest-risk routes is the fastest way to generate the before/after evidence both your finance team and your broker need.
Lower your fleet insurance cost with evidence
See how Oraigo supports insurance negotiations on our insurance premium reduction page, or go straight to the data: start a free pilot or talk to one of our specialists.