Fleet risk management is the structured process of identifying the hazards that cause accidents, injuries and financial losses across a fleet, assessing how likely and severe each one is, putting controls in place, and monitoring those controls as operations change. Done well, it turns fleet safety from a reactive cost centre into a proactive discipline that cuts incidents, lowers insurance costs and protects drivers.
The most practical tool for the job is the risk register. This guide builds a worked register across the five risk categories every fleet manager needs to address, with fatigue treated as the priority it deserves to be.
Key takeaways
- Fleet risk is best managed as a continuous cycle: identify, assess, mitigate, monitor.
- Score every risk as likelihood × consequence (1–25). Anything rated 15 or above needs immediate action.
- Driver fatigue is the highest-rated fleet risk at 20/25, contributing to around 20% of fatal road accidents.
- Physiological monitoring is the control that brings fatigue’s residual risk down from 20 to 8.
Why fleet risk management needs a framework, not a list
Most fleets have a safety checklist. A checklist tells you whether a pre-trip inspection was completed. A risk framework tells you which routes, shifts, drivers and vehicles carry the highest incident probability, why, and what needs to change before an incident happens. One manages paperwork. The other manages risk.
The framework follows the four-stage cycle used in every serious operational discipline:
Applied to each risk category, this cycle produces a register that is both a management tool and a governance document: proof to regulators, insurers and clients that risk is managed systematically, not reactively.
How to score a fleet risk register
Every entry should record the hazard, a likelihood score (1 = rare, 5 = almost certain), a consequence score (1 = negligible, 5 = catastrophic), the controls in place, the residual score after controls, a control owner and a review date. Multiply likelihood by consequence to get the risk rating.
The five risk categories at a glance
Here is how the five categories score before and after controls. Fatigue starts highest and, with the right controls in place, drops the furthest.
Risk 1: Driver fatigue
Fatigue sits at the top of most long-haul and overnight registers because it combines high likelihood with catastrophic consequences. Unlike alcohol, it can’t be detected at a roadside check, can’t be reliably self-assessed by the driver, and leaves no trace in vehicle data until it’s too late.
- Hours-of-service monitoring via digital tachograph
- Pre-shift self-assessment and fatigue awareness training
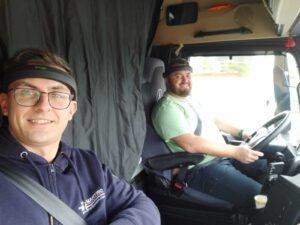
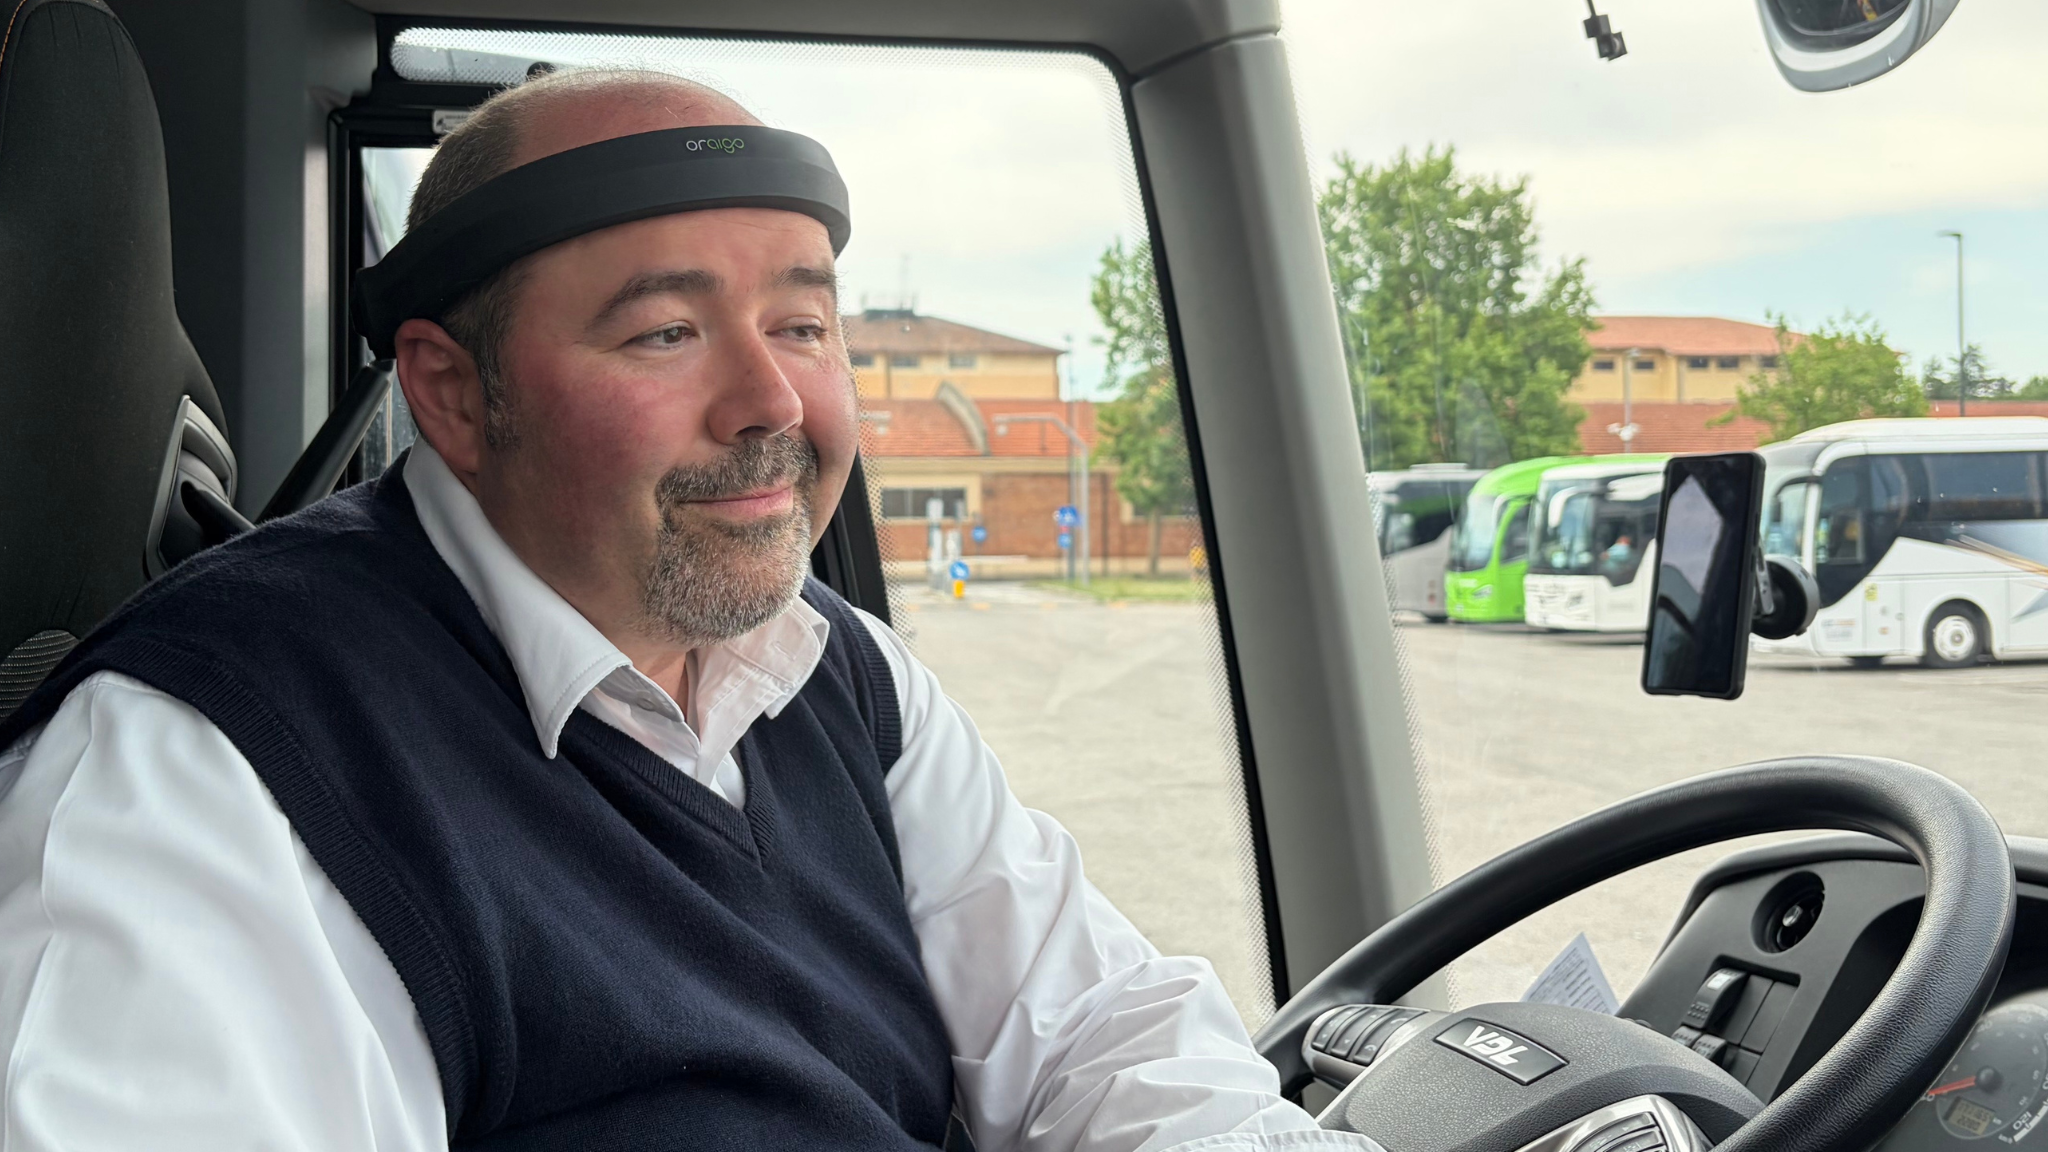
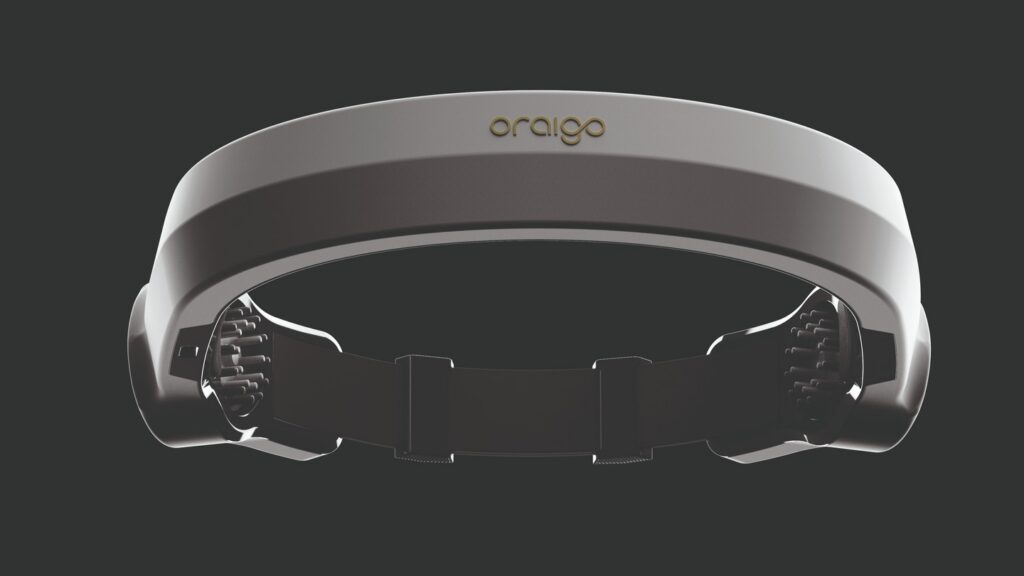
- EEG-based monitoring with Oraigo Aigo, with real-time fleet dashboard alerts
- Camera-based secondary detection and scheduled rest stops on high-risk routes
The control hierarchy for fatigue
The most effective fatigue controls follow a clear hierarchy, from most to least protective:
💡 Key insight: Scheduling and self-reporting alone leave fatigue largely unmanaged at the physiological level. Monitoring the driver’s actual neurological state is what moves residual risk from high to medium.
📘 Read more: how EEG spots fatigue before the driver feels it, in How Oraigo uses EEG technology to prevent fatigue.
Risk 2: Driver behaviour and distraction
After fatigue, behaviour is the largest contributor to incident risk: speeding, harsh braking, aggressive cornering, tailgating and phone use. The two interact. A tired driver is more likely to seek distraction to stay alert, a risk multiplier that systems treating fatigue and distraction separately can miss.
- Telematics scoring of speed, braking, acceleration and cornering
- In-cab cameras to capture distraction and phone use
- Regular coaching sessions based on telematics data
- Speed limiters and a progressive penalty framework
💡 Key insight: Use the data for coaching, not just discipline. Fleets that tackle root causes such as fatigue, time pressure, training gaps or route design see lasting improvement. Punitive-only approaches bring short-term compliance, then evasion.
Risk 3: Vehicle condition and maintenance
Tyre failures, brake defects and lighting faults are behind many serious incidents. The risk grows when operational pressure discourages drivers from reporting defects that would take a vehicle off the road.
- Digital pre- and post-trip inspections
- Predictive maintenance from vehicle diagnostic data
- No-penalty defect reporting with a clear escalation path
- Vehicle age, mileage and tyre replacement thresholds
💡 Key insight: A reporting culture is built by managers, not policies. Every overridden defect report weakens it; every quick fix and word of thanks strengthens it.
Risk 4: Route and environmental risk
Not every kilometre carries the same risk. High-speed motorway sections, low-visibility mountain passes, busy urban areas and remote roads far from emergency services all create predictable risk profiles you can assess and manage.
- Risk assessment for new routes, reviewed yearly for existing ones
- Enhanced fatigue monitoring on routes above defined risk thresholds
- Scheduled rest stops on remote high-risk routes
- Seasonal winter protocols and real-time weather alerts
💡 Key insight: Target the hotspots. Combining telematics, fatigue alerts and incident history pinpoints the route sections with disproportionate risk. Investing there delivers more than spreading improvements evenly.
Risk 5: Regulatory and compliance risk
Non-compliance brings fines, vehicle prohibitions, licence suspensions and public enforcement records that clients and insurers can see. And as transport regulation moves toward higher technology standards, the bar keeps rising.
- Automated hours-of-service exception reporting
- Internal audits for each operating jurisdiction
- Regulatory change monitoring with a named owner
- Automated driver licence validity checks
💡 Key insight: Stay ahead of the mandate. The EU General Safety Regulation’s driver drowsiness warning requirement is a first step toward more advanced physiological monitoring. Fleets that go beyond today’s rules reduce tomorrow’s compliance risk.
📘 Read more: everything on the regulatory requirements in our GSR II and DDAW page.
Keeping the register alive
A register that’s completed once and filed doesn’t manage anything. It only works when it’s built into a regular review rhythm:
Why fleet risk management pays off
Fewer incidents mean lower insurance premiums, lower repair costs, fewer disruptions and less legal exposure. Drivers stay longer with employers who visibly prioritise their safety, and strong safety records win procurement decisions.
The fleets that get the most from safety investment measure its return: incidents prevented, premium changes, and safety reported alongside financials at board level. Safety justified only on moral grounds is vulnerable to cost pressure. Justified on moral and financial grounds, it lasts.
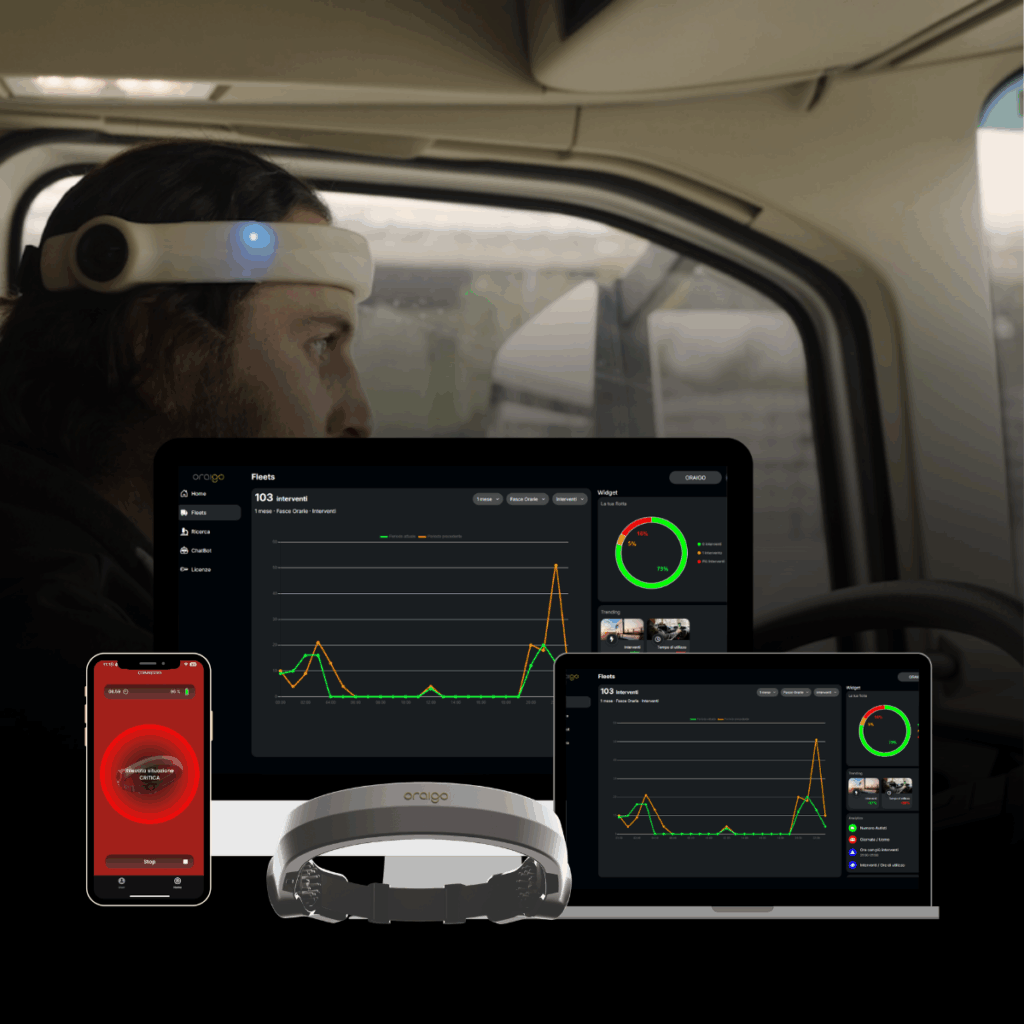
Ready to tackle your highest-rated risk? Oraigo’s EEG-based monitoring is the engineering control that moves driver fatigue from high to medium residual risk in your register. Start a free pilot or talk to one of our specialists.